Introducing Benchmark: Turning Plant Tissue Data Into Fertility Feedback
- Xavier Hébert-Couturier

- Jun 10
- 6 min read
At Picketa, our mission is to help agronomists and ag retailers unlock the full potential of plant tissue analysis through real time crop insights and practical agronomic decision making tools.
Through the LENS and Fieldbook platform, our focus has always been to make plant tissue analysis faster, more accessible, and more actionable during the growing season. As more agronomists began using the system across more crops, farms, and growing seasons, a larger opportunity started to emerge: How can agronomists organize and learn from the growing volume of plant tissue data being collected across commercial fields?
Today, we’re excited to announce that the Benchmark Creator is now live for all agronomists using Picketa's Fieldbook.
Benchmark is a new analysis and comparison system designed to help agronomists transform historical plant tissue datasets into practical agronomic insight.

What Is Benchmark?
Benchmark allows agronomists to build custom reference datasets using historical tissue samples collected through Fieldbook.
Users can group data together using filters such as: crop, nutrient, farm, individual field, variety, crop year, fertility strategy, treatment program, sampling period, and more.
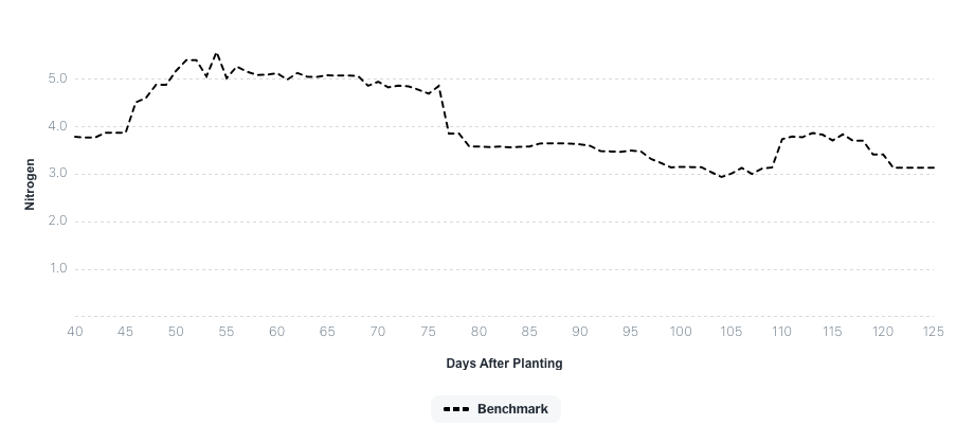
Once grouped, Fieldbook generates nutrient trend lines across the growing season, allowing agronomists to visualize how nutrients behaved across similar production systems over time.
Rather than reviewing isolated tissue tests one sample at a time, Benchmark helps users analyze broader nutrient patterns across fields, fertility programs, and seasons.
This allows agronomists to compare current crop performance against historical field outcomes and identify meaningful trends that may otherwise remain hidden inside disconnected spreadsheets and reports.
Why We Built It
Over the past several seasons, one of the clearest pieces of feedback from agronomists has been the need for better retrospective analysis tools.
As hundreds of fields and thousands of tissue samples accumulated inside the platform, users increasingly wanted a better way to organize historical plant tissue data, compare crop seasons over time, and understand how fertility strategies performed under real production conditions.
Historically, much of this work has been done manually.

Agronomists export tissue reports into spreadsheets, combine multiple datasets together, organize crop years by hand, and attempt to identify meaningful trends across disconnected reports, fertility plans, and field observations.
While effective, these workflows are time consuming, difficult to scale, and often limited by the amount of time available for post season analysis.
Benchmark was built to bring this process directly into Fieldbook.
Instead of managing retrospective analysis externally, agronomists can now create benchmark datasets directly inside their workflow and continuously refine them as more field data becomes available.
Building a Continuous Fertility Feedback System
Benchmark is designed to be more than a reporting or visualization tool.
Its purpose is to help agronomists establish a continuous feedback system between fertility decisions, plant nutrient response, seasonal crop development, and final field outcomes.
By aggregating tissue datasets across crops, farms, varieties, fertility programs, regions, and crop years, agronomists can begin evaluating how nutrient trends evolve under different management strategies and production environments.
This creates the foundation for a more connected agronomic workflow where historical field performance can directly inform future fertility recommendations.
Over time, Benchmark helps transform tissue analysis from a collection of isolated measurements into a continuously improving decision support system.
Rather than simply storing plant tissue data, the platform helps agronomists convert seasonal field observations into operational knowledge that can support fertility planning year after year.
Built Directly Into the Existing Fieldbook Workflow
One of the core design goals behind Benchmark was ensuring that retrospective analysis remained closely integrated with day to day agronomy workflows. Benchmark is not a separate analytics platform requiring external exports or disconnected reporting tools, It is built directly into Fieldbook.
As tissue samples are collected throughout the season, agronomists can immediately:
· Aggregate field datasets into benchmark groups
· Compare current crop years against previous seasons
· Visualize nutrient trend lines across benchmark datasets
· Analyze seasonal nutrient movement patterns
This allows tissue analysis and retrospective analysis to operate within the same workflow, reducing reliance on manual spreadsheet analysis while making historical field data significantly easier to interpret and reuse.
Using the Benchmark Creator

The Benchmark Creator is designed to help agronomists organize and analyze historical plant tissue datasets directly inside Fieldbook.
The feature is now available through a dedicated Benchmark tab located in the left navigation menu for agronomist accounts.
For this first release, Benchmark access is limited to agronomist users while the workflow continues expanding and evolving. Users can create an unlimited number of benchmark datasets and choose whether benchmarks remain private or are shared across their organization.

Creating an Effective Benchmark
An effective benchmark should represent a meaningful production environment or agronomic question.
In many cases, stronger benchmarks are built from:
· Larger sample sizes
· Similar production conditions
· Similar yield outcomes
· Consistent sampling timing
· Comparable fertility strategies
The goal is not simply to average data together, but to create reference datasets that help contextualize nutrient behavior under real field conditions.
Steps to Create a Benchmark
1. Select Data Source
Choose the source used to build the benchmark dataset:
· Service Provider – the operator of the LENS collecting the samples.
· Individual Farm – fields grouped together under a specific farm.
This determines which tissue datasets are available for aggregation.

2. Select Filters

Users can refine benchmark datasets using filters such as:
· Farm
· Crop
· Nutrient
· Sampling date range
· Fields
· Cropyears
These filters can be combined together to create highly specific benchmark datasets depending on the agronomic question being analyzed.
For example, users may choose to analyze:
· Corn tissue samples from a single region
· Potato petiole from a certain variety trends across multiple farms
· Specific fertility program datasets
· Replicated trials across regions and years
· High yielding cropyears only
As filters are adjusted, the benchmark graph updates automatically to help users visualize how nutrient trend lines change across the selected dataset.
3. Set Averaging Window and Window Alignment
Define the averaging window used to smooth nutrient trend lines over time.
For example, a 7 day averaging window helps reduce short term fluctuations and visualize broader seasonal nutrient movement patterns. The default averaging window is set to 7 days.
Select how the averaging window aligns with each data point:
· Past
· Centered
· Future
The default setting uses centered alignment.

4. Configure Sharing Permissions
Benchmarks can remain private or be shared across an organization depending on the selected scope and user permissions.

5. Save Benchmark
Add a benchmark name and description for future reference.
Saved benchmarks can later be reused for in season comparisons, retrospective analysis, and future fertility planning workflows.

The First Iteration of Benchmark
This first release of Benchmark focuses primarily on helping agronomists:
· Create practical benchmark datasets
· Organize tissue data across production environments
· Analyze nutrient trend lines over time
· Build reusable agronomic reference datasets
As more users build benchmark datasets and continue accumulating crop year information, the system will continue evolving.
One of the next major planned integrations is direct connectivity between Benchmark and Custom Critical Levels, currently planned for release by Fall 2026 for post season analysis of the 2026 growing season.
Critical levels help define nutrient targets while Benchmarks show historical nutrient trends.

Together, these systems create the foundation for a more adaptive agronomic workflow capable of continuously improving fertility recommendations using real commercial field outcomes.
Looking Forward
By helping agronomists structure historical plant tissue datasets into reusable agronomic reference systems, we hope to make fertility programs more informed, more adaptive, and ultimately more effective over time.

The Benchmark Creator is now live for all agronomists using Fieldbook and represents the first step toward building a continuous fertility feedback system inside the platform.
As more growers and agronomy teams adopt real time tissue analysis workflows, the ability to organize, compare, and learn from historical field outcomes becomes increasingly valuable. Benchmark was built to help agronomists move beyond disconnected spreadsheets and begin creating reusable agronomic knowledge directly inside their day to day workflow.
This release is only the beginning. Future updates will continue expanding benchmarking capabilities, retrospective analysis tools, and integrations with systems like Custom Critical Levels to help teams refine fertility programs season after season using real commercial field data.
To learn more about getting access to Fieldbook and securing a LENS unit for the 2026 growing season, visit: https://www.picketa.com/secureyourlens


Comments